Clash-Tracing Deployment
Clash-Tracing Deployment
Recently I deployed a clash server behind my dormitory router, but in the past few days I have noticed an unusual increase in proxy dialing traffic. Hence I wanted to investigate into what have been causing the exceptional high traffic overhead. I leverage the tool called clash-tracing and thereby I’m here to record how I deployed it in my dormitory network.
Demand Analysis
What I want is a tool that can run in windows platform and can monitor the proxy traffic of clash.
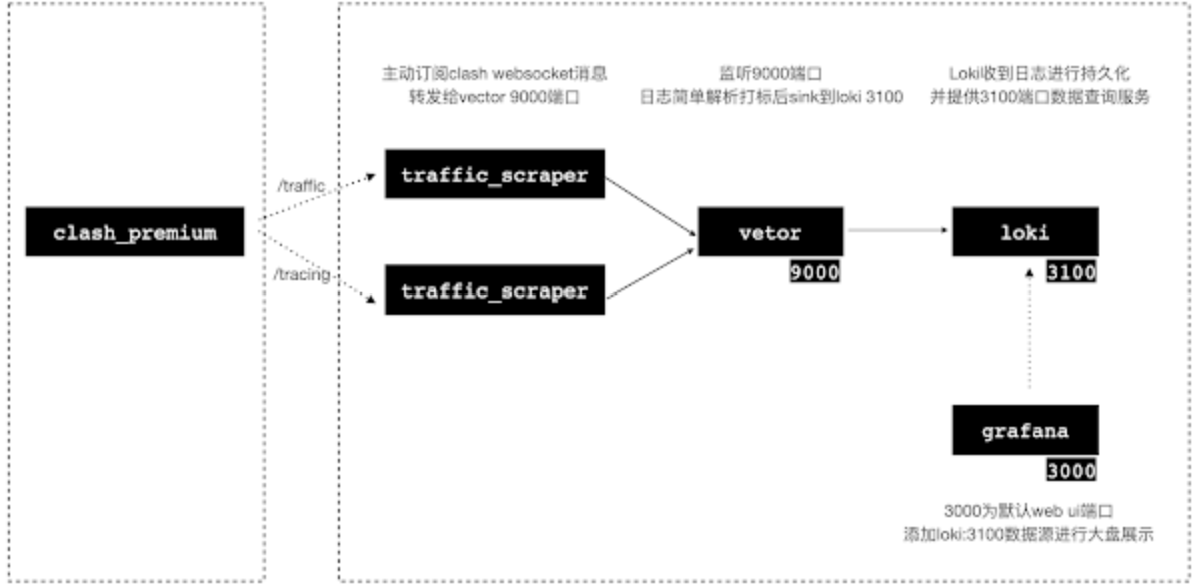
clash-tracing utilizes clash core’s tracing feature which send logging info out from the core using websocket . Then it uses loki to store the data in the database and finally visualizes it using grafana.
The whole service is wrapped in a docker environment. A docker compose file is used to regulate all third-party containers used in clash-tracing and designate the instructions each container need to performs to connect them together.

However, the whole service is meant to be running on Linux. It remains uncertain whether windows platform will support the environment used in the service. So I begin to explore it deeper.
Trails and Errors
The good news is that in windows docker offers the docker desktop which is an even more noob-friendly tool to set up a docker environment similar to Linux, as it provides visualization and GUIs replacing commands that are hard to remember.
The first time I try to use docker to set up the whole service, it fails to open port 3000 for the grafana container. Thanks to GPT, I quickly addressed the problem by setting the port mapping from 3000->3000 to 3000->13000
But still, although all the containers are running now, websocat containers raises error logs that the websocket connection to the clash core is malfunctioning. I used the wscat tool to connect to the clash core logging server URL, and it returned with correct response. Thanks again to GPT, it found out that the URL specified in the docker-compose file uses 127.0.0.1 to represent the host machine. But that 127.0.0.1 will be interpreted by the container as the container itself. The correct form should be host.docker.internal
Finally, just to mention that if you are using clash-for-windows, the clash_host URL should be in /user/.config/clash/.config , specified by the term external-handler.
After all these changes to the docker-compose file, if you also have an environment to run docker, all preparation steps are done.
Just run docker either in GUI interface or in shell docker-compose up -d (remember to install docker-compose using scoop, extremely fast!)
The configured docker-compose.yml is given below
1 | version: '3' |


